入门基础(五)Layer详解

Layer 是什么
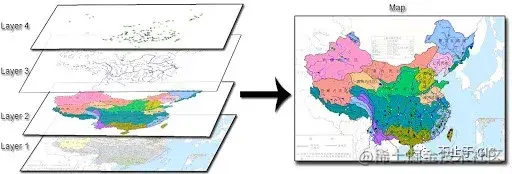
图层就像是含有文字或图形等元素的图片,一张张按顺序叠放在一起,组合起来形成页面的最终效果。Layer就是创建这一张张图的函数。
Layer是派生所有图层类型的基类。定义了诸多不同图层类型共用的特征和方法。
要使用Layer需要先从 source 接收到的数据,然后添加到 map 中。
常用参数
className 设置图层元素的 CSS类名称。
extent 图层渲染的边界范围。
zIndex 图层渲染的 z-index。在渲染时,图层将被排序,首先是 Z-index,然后是位置。
source 该层的数据来源。
map 地图实例。
render 将覆盖图层的默认渲染。
常用监听事件
prerender 图层开始渲染之前。
postrender 渲染完成之时。
error 发生任何错误。
change 图层发生修改。
OpenLayers中的图层类型
Graticule,地图上覆盖的网格标尺图层。
HeatMap,热力图。
Vector,矢量图。
VectorImage,单张的矢量图层。
VectorTile,矢量瓦片图层。
WebGLPoints,WebGL渲染的海量点图层。
Tile,栅格图层。
使用图层
Graticule 图层
- 为坐标系渲染网格的层(目前仅支持 EPSG:4326)。请注意,视图投影必须同时定义范围和世界范围。
    var gra = new ol.layer.Graticule({
      strokeStyle: new ol.style.Stroke({
        color: 'rgba(255,120,0,0.9)',
        width: 2,
        lineDash: [0.5, 4]
      }),
      showLabels: true,
      wrapX: false
    })
    map.addLayer(gra)
HeatMap 图层
- 用于将矢量数据渲染为热图的层。
- 通过 blur 控制圆点的边缘,对边缘做模糊化。radius 则规定了圆点的半径。
    var vector = new ol.layer.Heatmap({
      source: new ol.source.Vector({
        url: 'https://openlayers.org/en/latest/examples/data/kml/2012_Earthquakes_Mag5.kml',
        format: new ol.format.KML({
          extractStyles: false
        })
      }),
      blur: parseInt(5),
      radius: parseInt(2)
    })

    map.addLayer(vector)
Vector 图层
- 矢量图层是用来渲染矢量数据的图层类型,一般用于绘制区域覆盖层。
    var source = new ol.source.Vector({
      url: 'https://openlayers.org/en/latest/examples/data/geojson/countries.geojson',
      format: new ol.format.GeoJSON()
    })

    vectorLayer = new ol.layer.Vector({
      //初始化矢量图层
      source: source,
      style: new ol.style.Style({
        stroke: new ol.style.Stroke({
          //线样式
          color: '#ffcc33',
          width: 2
        })
      })
    })
    map.addLayer(vectorLayer)
WebGLPoint 海量点图层
- 当数据量大的时候,我们需要在图层上绘制点。使用WebGLPoint能大量提升性能。
- WebGLPoint Layer 是由 WebGL 作为渲染引擎的点图层,众所周知,WebGL在渲染大量数据(>10k)效率明显优于Canvas或SVG,所以对于有大数据量前端渲染需求的,WebGL作为渲染引擎几乎是唯一的选择。
   const vectorSource = new ol.source.Vector({
      url: 'https://openlayers.org/en/latest/examples/data/geojson/world-cities.geojson',
      format: new ol.format.GeoJSON()
    })
    let pointLayer = new ol.layer.WebGLPoints({
      source: vectorSource,
      style: {
        symbol: {
          symbolType: 'circle',
          size: ['interpolate', ['linear'], ['get', 'population'], 40000, 8, 2000000, 28],
          color: '#006688',
          rotateWithView: false,
          offset: [0, 0],
          opacity: ['interpolate', ['linear'], ['get', 'population'], 40000, 0.6, 2000000, 0.92]
        }
      }
    })

    map.addLayer(pointLayer)
总结
在GIS地图的开发中,图层是非常核心的概念。随着理解的深入,你会发现地图的展示都是通过不同的图层,一层层的覆盖上去。
在OpenLayers中图层是一等公民,简单来说就是所有功能都是基于图层实现的。比如海量点功能,第一层加载栅格瓦片图层,然后通过海量点图层绘制图像,然后覆盖到栅格瓦片图层上。
ch3
© 著作权归作者所有
ES6 教程
JSON解析格式化
JS在线运行
JAVA8新特性教程
jsfiddle中国国内版本
屏幕坏点检测工具
subline官方下载
JS在线运行编译
PHP在线运行编译
Java在线运行编译
C语言在线运行编译
Bash在线运行编译
C++在线运行编译
Ruby在线运行编译
Lua在线运行编译
Python在线运行编译
Go语言在线运行编译
Groovy在线运行编译
Dart在线运行编译
JSRUN前端笔记, 是针对前端工程师开放的一个笔记分享平台,是前端工程师记录重点、分享经验的一个笔记本。JSRUN前端采用的
MarkDown 语法 (极客专用语法), 这里属于IT工程师。